Pet names

Which names are more cat-like, dog-like, and human-like?

Random graphs
Author

Jonatan Pallesen

Published

March 27, 2019

The tidytuesday data set has a large number of pet names from Seattle. A data set with human names can be easily acquired from the Tidyverse package babynames.

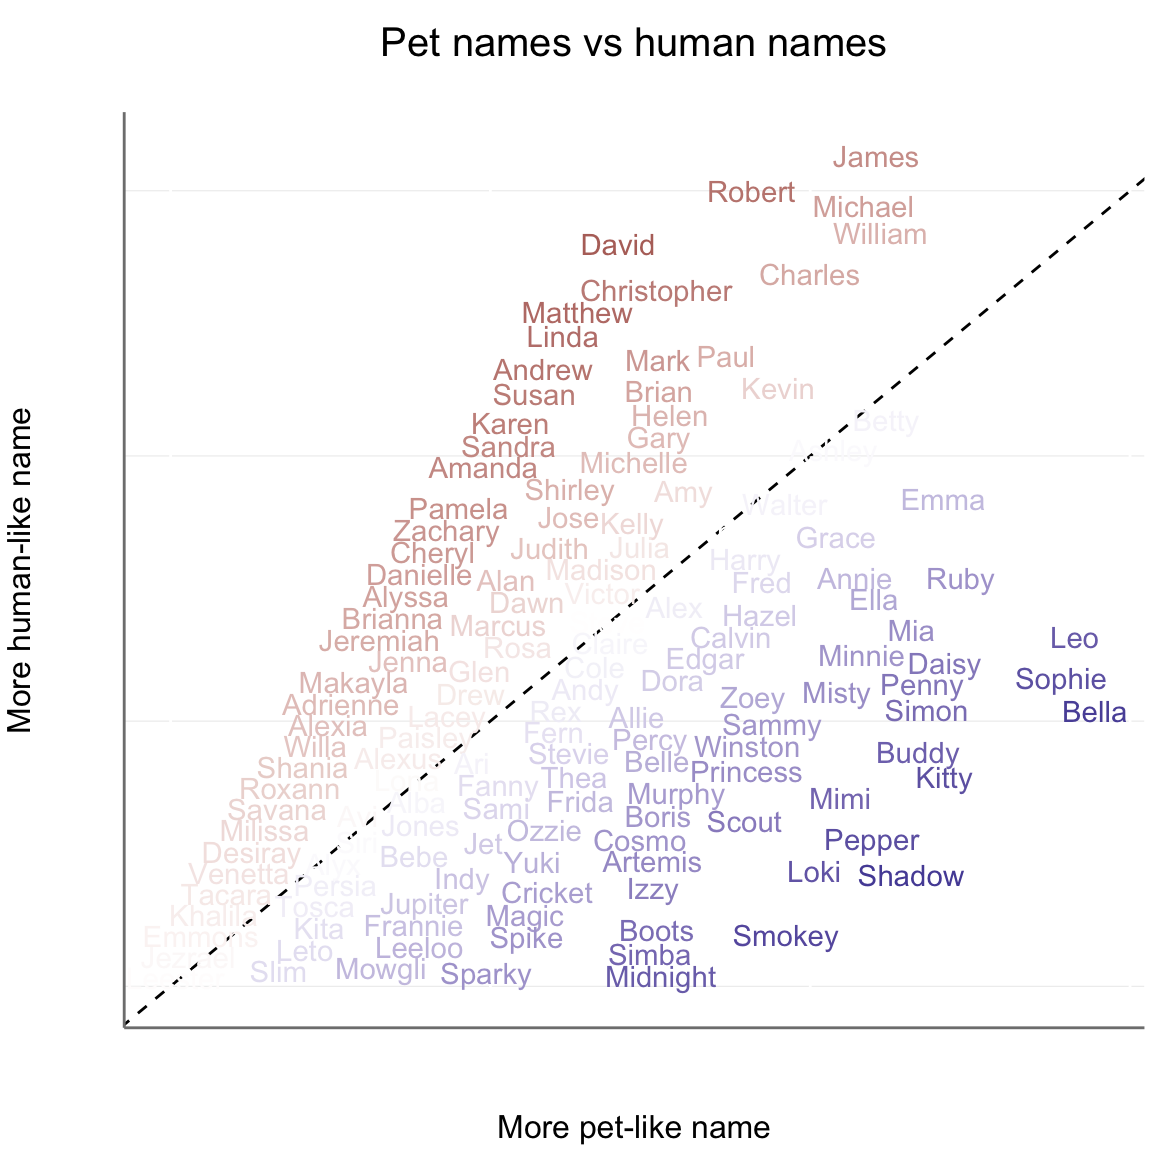
I investigate which names are more typical of pets compared to humans, and which names are more typical of humans compared to pets.

Code
library(babynames)
library(jsmp)

fn = "https://raw.githubusercontent.com/rfordatascience/tidytuesday/master/data/2019/2019-03-26/seattle_pets.csv"

pets <- read_csv(fn) |>   
  mutate(name = animals_name,
         n = 1) |> 
  drop_na(name)

get_rank <- function(df, c){
  df |> 
    group_by(name) |> 
    summarise(n2 = sum(n)) |> 
    arrange(desc(n2)) |> 
    add_count() |> 
    mutate(
      rvalue = row_number() / n * 10000,
      rank = log(log(10 + n)) - log(log(10 + row_number()))) |> 
    select(name, !!glue("{c}_rank") := rank)
}

ranks <- babynames |> 
  get_rank("human") |> 
  full_join(pets |> filter(species == "Dog") |> get_rank("dog")) |> 
  full_join(pets |> filter(species == "Cat") |> get_rank("cat")) |> 
  mutate(
    human_rank = replace_na(human_rank, 0),
    cat_rank = replace_na(cat_rank, 0),
    dog_rank = replace_na(dog_rank, 0),
    cat_human_diff = cat_rank - human_rank,
    catdog_rank = cat_rank + human_rank / 2,
    dog_human_diff = dog_rank - human_rank,
    dog_cat_diff = dog_rank - cat_rank,
    catdog_human_diff = catdog_rank - human_rank,
    dog_cat_sum = dog_rank + cat_rank
  )

plotg <- function(df, a, b, diff, name){
  df |> 
    ggplot(aes({{a}}, {{b}}, label={{name}}, color={{diff}})) +
    geom_abline(intercept=0, slope=1, linetype="dashed") +
    geom_text(check_overlap=T) +
    scale_colour_gradient2(low = muted("red"), high=muted("blue")) + 
    gg_legend_remove() +
    ylim(0, 1.57) + xlim(0, 1.45) +
    theme( 
      axis.title.y = element_text(margin = margin(t = 0, r = 30, b = 0, l = 0)),
      axis.title.x = element_text(margin = margin(t = 30, r = 0, b = 0, l = 0)),
      text = element_text(size=13),
      axis.text.x = element_blank(),
      axis.text.y = element_blank(),
      axis.ticks = element_blank(),
      plot.title = element_text(size = 15, hjust = 0.5)
      ) 
}
Code
plotg(ranks, catdog_rank, human_rank, catdog_human_diff, name) +
  labs(x = "More pet-like name", 
       y = "More human-like name", 
       title = "Pet names vs human names")


Code
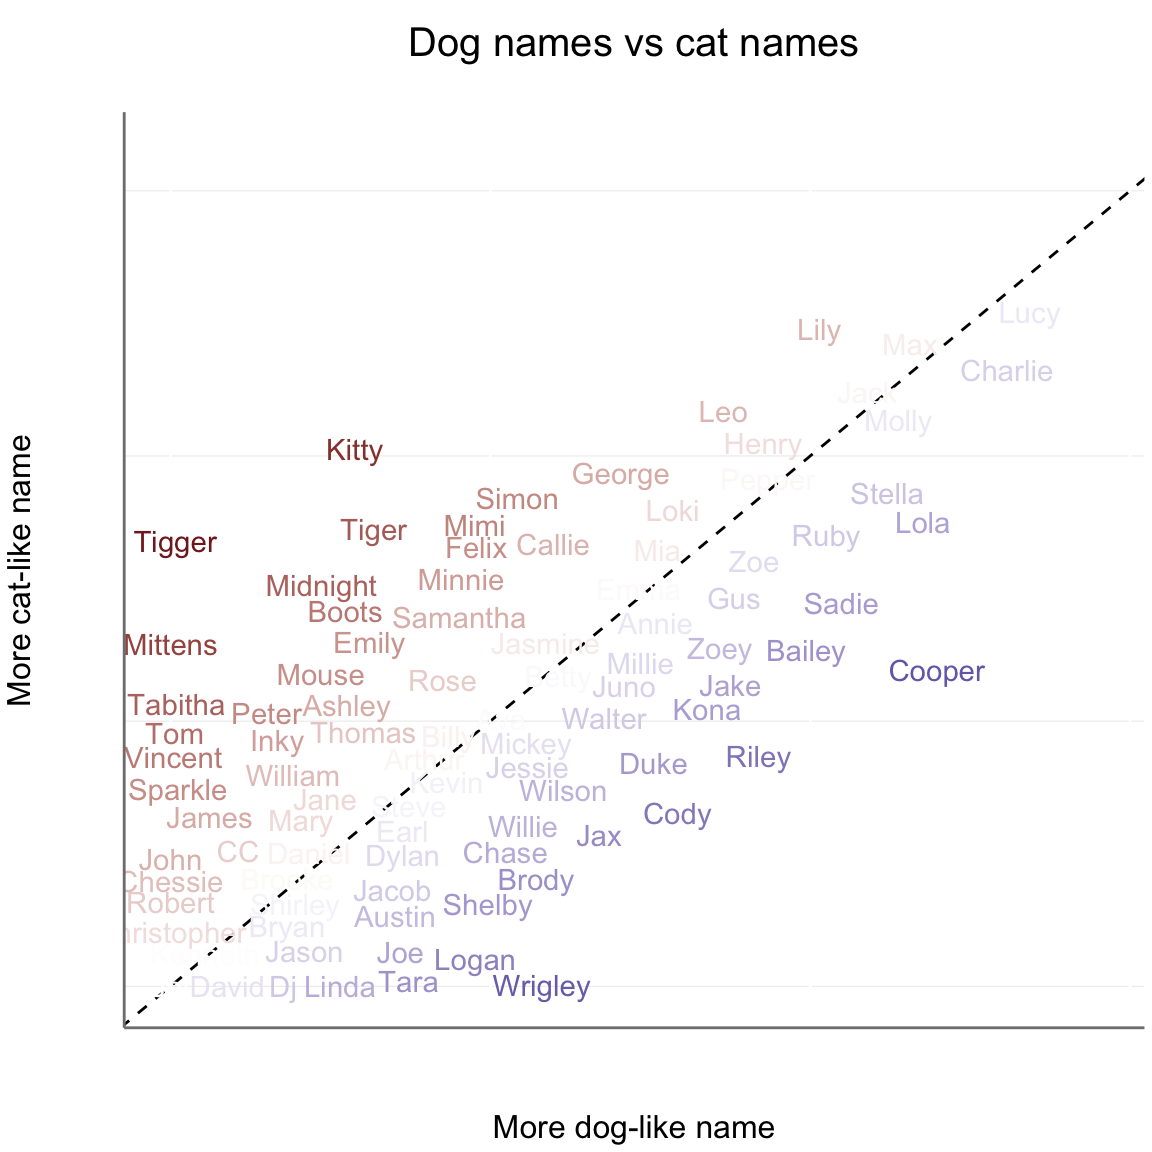
plotg(ranks, dog_rank, cat_rank, dog_cat_diff, name) +
  labs(x = "More dog-like name", y = "More cat-like name", title = "Dog names vs cat names")